Video Duration: 41 min.
Native Country of Student: India
Rating: 5.5
|
Task Achievement: 6 Coherence & Cohesion: 5 Grammatical Range & Accuracy: 6 Lexical Resources: 5 |
🧑🏫 About the Lesson
In this lesson, William reviews and rates an essay that was written by an Indian student in response to the following IELTS Writing Task 1 prompt:

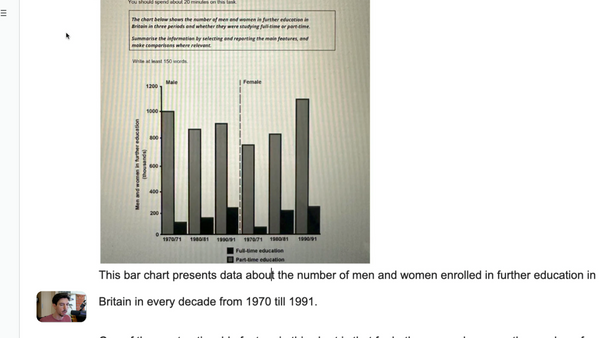
The chart below shows the number of men and women in further education in Britain in three periods and whether they were studying full-time or part time.
Summarize the information by selecting and reporting the main features, and make comparisons where relevant.
By the end of this lesson you'll be able to:
- Use :location elements to introduce figures, tables, and data sets;
- Organize the information in your passage to best represent key insights from the data set;
- Understand when to use numerals and when to spell out numbers in data commentaries;
- Use pronominal reference to create :cohesion within the passage;
- Distinguish between academic and everyday, spoken :registers.
💁♂️ Model Response
🌟
Here's an example of a Band 9 response
| This bar chart shows an inverse trend of men in Britain transitioning from part-time to full-time education and an increasing trend of British women enrolling in both types of further education across the seventies, eighties, and nineties. This period saw a steady rise in full-time education enrollment across genders. The number of males more than doubled to over 200 thousand by 1990/91, while that of women reached this level a decade sooner. Conversely, there has been a contrasting trend among genders enrolling in part-time education during this period. Among males there was a significant drop in the first decade (1970/71: 1 million; 1980/81: 900 thousand), but this grew slightly by the end of the period (950 thousand). Although at the start of the seventies there were roughly 30 percent fewer females than males enrolled in part-time education, the portion of females grew steadily over the years, reaching 1.1 million by the start of the nineties. |