Video Duration: 30 min.
Native Country of Student: India
Rating: 6.5
|
Task Achievement: 7 Coherence & Cohesion: 6 Grammatical Range & Accuracy: 6 Lexical Resources: 6.5 |
🧑🏫 About the Lesson
In this lesson, William reviews and rates an essay that was written by an Indian student in response to the following IELTS Writing Task 1 prompt:

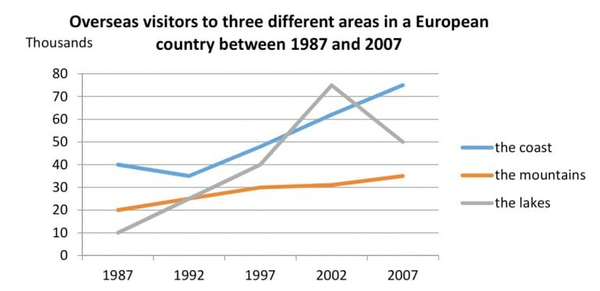
The graph below shows the number of overseas visitors to three different areas in a European country between 1987 and 2007
Summarise the information by selecting and reporting the main features, and make comparisons where relevant.
You should write at least 150 words.
By the end of this lesson you'll be able to:
- Use :location elements to introduce figures, tables, and data sets;
- Organize the information in your passage to best represent key insights from the data set;
- Understand when to use numerals and when to spell out numbers in data commentaries;
- Use pronominal reference to create :cohesion within the passage;
- Distinguish between academic and everyday, spoken :registers.
📝 Student Response
🌟
Here's the original response, rated at Band 6.5
| The graph illustrates the number of tourists to three distinct regions in an European country, spanning from 1987 to 2007. Overall, the places have experienced an increased tourist attraction from the past two decades. Initially, the coast, with around 40,000 visitors, was known to be the most popular region among the three. On the contrary, the lakes were the least liked, only comprising of around 10,000 visitors. It is also notable that both the coast and the lakes had the same number of maximum visitors in this period, which was around 75,000. By 2007, the coast had become the most popular tourist destination, having visited by almost 75,000 visitors. Although the lakes too saw a steep rise initially, the visitors started to decline, gaining the maximum attraction of approximately 75,000 tourists in 2002. By 2007, it had declined to 40,000 visitors. The mountains, surprisingly did not experience any great inclination. They only had around 15,000 more visitors since 1987. |
💁♂️ Model Response
🌟
Here's an example of a Band 9 response
| The graph above illustrates the number of tourists to three distinct regions in aEuropean country, spanning from 1987 to 2007. Overall, the zones have experienced an increased tourist attraction over the past two decades. The first decade saw a general increase of overseas visitors to all areas. The lakes saw five times as many tourists in 1997 as it did at the beginning of the period, while the mountains and coast saw an increase of ten thousand visitors each. This overall rise for the coast was punctuated by a slight decline of five thousand in 1992, from which it rebounded to 50 thousand over the next five years. The second half of the period saw the most gains going to the coast, which received 50 percent more tourists overall. More modest gains went to the lakes and the mountains, which grew by ten thousand and five thousand respectively. The former initially saw a steep increase in tourists, reaching a high of 75 thousand in 2002, but by the end of the period this figure had declined to 50 thousand. |