Table of contents
Audio problem until about 4m30s – sorry about that! Still learning my way around the live-streaming software. Audio is also a little quiet; it will be louder in future episodes.
IELTS Writing Task 1 Prompt
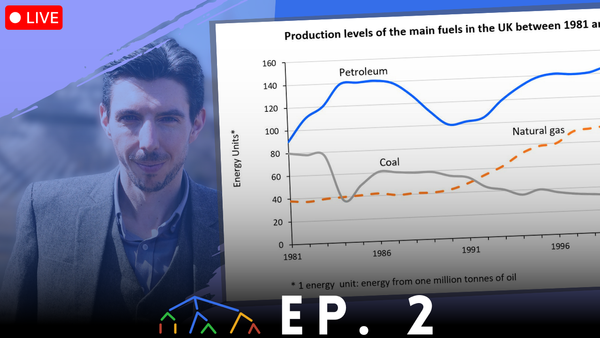
The graph below shows the production levels of the main kinds of fuel in the UK between 1981 and 2000.
Summarize the formation by selecting and reporting the main features and make comparisons where relevant.
You should write at least 150 words.

Original Response
From 1981 to 2000, petroleum remained as one of the main fuels with the highest production levels. There was not a linear trend, however, as production levels rose from approximately 90 units in 1981 to 140 units by 1984 and remained stagnant up until 1987, when in the next year production levels plummetted. Production levels returned to its 1986-levels in the year 2000. On the other hand, the production levels of coal had been on a steady decline. Production levels initially declined drastically from approximately 80 units in 1983 to just approximately 35 units in 1984. This figure rebounced the following year and while the declining trend persists, it has become much more gradual. The production levels of natural gas hovered around the 40 units for the better part of the 1980s, This changed in the years 1991-1992, when production levels broke through the 50 unit mark, and it is projected to reach an all-time high in 2000, The years of 1991-1992 proved pivotal in the UK's fuel production away from coal, as both petroleum and natural gas saw a surge in production, while coal production decreased,
Analysis
Task Achievement
|
Do What |
With What |
|
Summarize |
the information |
|
select and report |
the main features |
|
Compare |
The main features when relevant |
Grammatical Range & Accuracy

Lexical Resources


Coherence & Cohesion

Audio problem until about 4m30s – sorry about that! Still learning my way around the live-streaming software. Audio is also a little quiet; it will be louder in future episodes.
